Introduction & Motivation
Given that there are over 180 student organizations present and active on the Wellesley College campus, extracurricular events on-campus are clearly an important aspect of student life. Even outside of Wellesley, participation in extracurriculars such as sports and fitness, show a demonstrated increase in student leadership development, academic performance, general well-being (physical, mental, emotional), and a strengthened sense of social belonging (Soria, Boettcher, & Hallahan, 2022)1. While these benefits are clear, there is a lack of research and understanding in higher education on “the effect on students of their attendance at on-campus lectures, performances, panels, and other cultural events.”2 To observe this effect further, a study at Juniata College used qualitative research methods, collecting 793 reflection papers written by 206 students describing their experiences and benefits from attending on-campus events. Of these results, 361 of the reflections described a positive impact, in which the students felt motivated to attend a similar event in the future or gained a deeper understanding of something new.
We aim to achieve a comprehensive understanding of how Wellesley College students learn about and decide to attend on-campus events. By identifying the most effective communication channels and understanding the motivations behind student attendance, we can propose guidelines to navigate these decentralized streams of event visibility and ensure equitable access to information accessible to all students. Our project is an investigative inquiry on the issue of decentralized/ fragmented technological communication. By providing a clear understanding of the current communication landscape and proposing targeted solutions, we can significantly transform the methods by which on-campus event organizers make their events visible to students in the community. For organizers, this means the ability to effectively reach a larger audience and maximize attendance, ensuring their efforts and hours of preparation are met with engagement. For attendees, it means having easier access to and knowledge of events, particularly those that align with their interests. By creating a public resource to bridge the gap between organizers and attendees, we can ensure that the incredible opportunities and experiences offered on campus are accessible to a broader community, bolstering individual feelings of togetherness and belonging for students and event organizers (more specifically, student organizations) alike. As prior research demonstrates an overall positive impact on student lives with greater event attendance, a potential solution, in turn, has the potential to enhance the overall college experience for the Wellesley community, solving not only immediate communication challenges but also contributing to the broader discourse on the ethical and effective use of technology in higher education/ campus communities.
1. Soria, K. M., Boettcher, B., & Hallahan, K. (2022). The Effects of Participation in Recreational Activities on Students’ Resilience and Sense of Belonging. Recreational Sports Journal, 46(2), 184-192. https://doi.org/10.1177/15588661221125201 [link]
2. Tuten, J., Westcott, K., Drews, D., White, B., & Talisman, N. (2015). Evaluating the Effects of Cultural Event Attendance: A Qualitative Approach. Juniata Voices, 15. [link]
Literature Review & Research Questions
A similar study conducted by the University of Tampa on motivations for students in their College of Business to attend on-campus events looked at the motivations behind students attending these events. The study found that “[s]ocial group status has been shown to drive a student’s motivation for attending out of school activities or after-school activities.” To understand how these motivations are nuanced for different kinds of on-campus events, the study “grouped extracurriculars into five groups: prosocial activities, sports teams, performing arts, school involvement, and academic clubs.” The study then looked into how attendance at these events impacted other aspects of their college experience including “college plans, GPA, alcohol usage, drug usage, and class attendance.” Results of the study indicated that in order to encourage greater participation of on-campus events, the most effective strategy to incentivize students was to offer extra credit upon attendance.3 Given that social factors and a reward system might be good motivators for students to attend these events, another aspect of on-campus events we want to understand is how students learn about them in the first place.
Given the positive impacts of on-campus event attendance, which is factored into student motivations to attend, we now ask the question: how do students learn about on-campus events in the first place? From personal observation, this problem space seems immensely fragmented across various communication channels: social media (Instagram, Facebook, Twitter, etc.), E-mail mailing lists, physical spam, group messaging platforms (iMessage, WhatsApp, GroupMe, etc.), and more. It becomes clear that technology has become increasingly important to communicate information, and potentially an increasingly relied-upon medium for promoting engagement in on-campus events. Our project seeks to observe the following research questions throughout this project:
1. How do students at Wellesley College learn about upcoming events, and what channels of communication are most effective in reaching them?
2. Does the current system of fragmented communication/ decentralized publicizing streams contribute to inequitable access to events and opportunities for different demographics or student groups?
3. Is there an oversaturation of overlapping events that prevent larger attendance to on-campus events? In other words, has an increasing density of events caused lower event attendance rates?
As reinstated from readings from Vallor, a core theme of our class is developing strategies to aid living well with technology: “As important as they are, the engineers of the 21st century who fashion code for machines are not as critical to the human mission as those who must fashion, test, and disseminate technomoral code for humans - new habits and practices for living well with emerging technologies. (pp 253)” The communication and discovery of on-campus events is an area of social development in the Wellesley community that has become increasingly reliant on technology. To navigate the various mediums in which this process has involved, we must first understand how current technology shapes students’ experiences in finding on-campus events. As our findings may reveal a gap in non-digital resources or pain points unaddressed by digital means, our project hopes to provide a public resource to share guidelines for the Wellesley community that may assist student organizations in reaching their goals with on-campus event participation.
3. Foltz, K. A., Clements, M., Fallon, A., & Stinson, A. (2021). Extra Credit and Decision-Making: Understanding College Students' Motivation to Attend On-Campus Events. Journal of Campus Activities Practice and Scholarship, 3(2), 5-15. [link]
Data Collection
To gain a holistic understanding of on-campus event communications, we used five methods and sources to gather data. First, we used a questionnaire survey sent to the largest reachable participant group via Google Group email groups, amassing over 1500 distinct student accounts collectively. Our survey asked questions relating to current and preferred methods for event communication, in addition to motivations behind event attendance. While our survey provided us with a sample of qualitative and quantitative data to form initial hypotheses about general student and event organizer behavior, we then used these results to conduct a more in-depth qualitative analysis throughout our focus group study (“Town Hall Meeting”) held on December 5th from 4:30 pm – 6 pm in Sci L039, which was open to the entire Wellesley community. From these results, we made preliminary observations on the influences of various criteria furthering student community engagement and obtaining higher visibility with event communications. To support these hypotheses, we used findings from 3 forms of secondary data results: a literature review from similar on-campus studies relating to publicity and community engagement, commonalities between student preferences and actual event actions recorded in 25Live – the event reservation system used campus-wide, and historical comparisons from archival collections dating from the 1970s to early 2000s.
These data collection methods allowed us to engage with our three primary stakeholder groups: 1) general on-campus event attendees (mostly the general student body), 2) event organizers (not limited to student organization leaders), and 3) college administrators who assist with campus-wide scheduling and venue reservations. Our exploration was shaped by the target stakeholder group by which each data collection method was the most accessible. As the survey method was a communication stream made in direct contact with students, it effectively engaged the general event attendee demographic by providing an accessible way to share preferences and motivations, giving a voice to a broad spectrum of attendees. Our focus group was created with event organizers and event attendee participants in mind, fostering dialogue between the two stakeholder groups to explore challenges and opportunities collaboratively. Lastly, our secondary data sources, which we collected with the assistance of the admin stakeholder group, such as 25Live and archival records, provided context for administrator decision-making and allowed us to identify trends and gaps in historical and current practices. The diversity of our data sources allowed us to cross-validate our findings, reinforcing conclusions where they overlapped and highlighting stakeholder-specific nuances where they differed. Ultimately, the synthesis of these results underscored the necessity for a centralized event communication system supported by high-quality data that addressed the needs of all stakeholders.
3.1 Survey
To start, we created a survey to poll the general student body and shared it across campus. We ended up getting 69 responses which were distributed as: 4 Faculty/Staff members and 65 Students including: 9 Eboard Members, 3 Student Workers for a Department, and 5 students who were both. The questions in the survey asked about how people were finding out about events and how they preferred to find out about events. Additionally, we asked the students who published events, what they usually advertised with and what they found were effective. We also collected a lot of personal responses and anecdotes that helped us understand how people felt about events on campus.
3.2 Townhall
In order to collect data for our research and to test our hypothesis, we held a Town Hall, focus group study involving two stakeholder groups, to hear what event attendees and organizers thought about how events are held and publicized on campus. We held the event primarily for students because we wanted to hear how they heard about events and if they had any improvements in mind from the consumer end. In holding this Town Hall, we also gathered ‘meta’ research as we ourselves had to hold an event and figure out how best to publicize it. We had to think through every logistic of hosting a Wellesley event including how to ensure attendance and which times/locations work best.
We ‘pubbed’ the event in multiple mediums, including physical SPAM, word of mouth, emailed SPAM to multiple groups, and individually sending out invites in personal group chats. In order to honor the Wellesley tradition of SPAMing, we created flyers inspired by clubs from the past. We made SPAM based off of the class of 1956 play and a Felding Medeival Society’s 2001 poster. (link below in website) In order to ensure attendance, we promised food to the attendees and served Thai food for dinner. We held the event on a Thursday evening at 4:30 in the science center so that people could come after class and not be held up too late.
We began our town hall with an overview of our project. We then broke our attendees into groups based on if they had ever hosted/planned an on campus event or if they had only ever attended. These groups then had four minute discussions for each question and then reported back to the larger group where we as a group discussed and responded to answers. After this process was repeated for five questions, our final question was to be answered on a google doc individually so we could have more in depth answers to the question. After the question process concluded, we presented the data we collected from our surveys to the group. We then had an open mic where the group could discuss whatever we didn’t get to.
3.3 25Live
An additional method of data collection we used for this project was 25Live, the primary tool used for on-campus event/ venue reservations. In meeting with individuals from our identified administrator stakeholder group; specifically, a member of the Office of Student Involvement, the college department which “helps students start and run new orgs as well as plan off-campus trips and on-campus concerts. And they make sure our hallowed traditions—like Lake Day and Hooprolling—continue from year to year.”4 and a member of the Events and Scheduling Office, which guides all eligible campus event organizers through their event scheduling and planning needs and manages the 25Live event reservation system, we designed and ran queries for all student events from 2018–2024 and a separate grouping of queries for all student events 2013–2024 for all student events with expected headcount with over 50 attendees. As an event reservation system5, a key limitation to the service is the inability to know live, actual data such as the number of people who actually attend an event and whether related events might have been double-booked (different organizations making several distinct reservations for the same event purpose). In conversation with this stakeholder group, we learned that while the software had been introduced to the community by 2013, there were no official enforcements that required booking via 25Live until 2018. Hence, we were directed towards analyzing data only from 2018 and beyond as it was deemed of higher quality and with less inconsistencies in its data. A summary of the system’s all time data (2013 and beyond) was shared with us to give a first glimpse into this data (see Table 1).
| 7/1/12-6/30/13 | 7/1/13-6/30/14 | 7/1/14-6/30/15 | 7/1/15-6/30/16 | 7/1/16- 6/30/17 | 7/1/17-6/30/18 | 7/1/18-6/30/19 | 7/1/19-6/30/20 | 7/1/20-6/30/21 | 7/1/21-6/30/22 | 7/1/22-6/30/23 | 7/1/23-6/30/24 | |
|---|---|---|---|---|---|---|---|---|---|---|---|---|
| SCHEDULING OFFICE | Total as of 6/30/13 | Total As of 6/26/14 | Total As of 6/10/15 | Total as of 6/23/16 | Total as of 6/14/17 | As of 6/4/18 | As of 6/30/19 | As of 4/24/20 | As of 6/30/21 | As of 6/30/22 | As of 6/30/23 | As of 5/28/24 |
| Student Involvement | 2369 | 2384 | 2521 | 2250 | 2639 | 2458 | 2487 | 2161 | 693 | 1907 | 2099 | 2315 |
| Total campus reservations | 7873 | 8019 | 8852 | 9476 | 9943 | 11,859 | 11,932 | 10,456 | 3225 | 8670 | 11,043 | 12,447 |
Regardless of the fields used for any particular data pull, each data pull retrieved from 25Live shared the following fields in its data: Event Name, Type, Status, Reference #, Organization, Title, Start Date, End Date, Initial Start Time, Initial End Time, Occurrence Count, Locations, Total Invoice, Requestor, Requestor Email, Requestor Phone, Scheduler, Scheduler Email, Scheduler Phone, Creation Date, Last Mod. Date, Last Mod. User, Event Owner, Categories. Beyond these attributes, a data pull would require specific queries from custom-defined fields to receive a subset of all events in the database. The main purpose of using 25Live as a secondary data source is its value to quantify historical data to understand the following trends: 1) does the number of events happening across campus reduce the opportunity for larger events – in other words, has an increase in event count lowered the number of events that are expected to see high attendance?; and 2) does an increasing number of events with similar criteria indiciate a student preference for that kind of event criteria? Thus, the data we collected primarily came from the following two search queries:
| ::type in ("Student: Announcement [ID:154]", "Student: Ceremony [ID:155]", "Student: Club Sport [ID:157]", "Student: Club Sport Contest [ID:192]", "Student: Club Sport Practice [ID:193]", "Student: Community Service [ID:158]", "Student: Concert [ID:159]", "Student: Conference [ID:160]", "Student: Dinner [ID:161]", "Student: Exhibit [ID:162]", "Student: Film Showing [ID:163]", "Student: Lecture [ID:164]", "Student: Lunch/Brunch [ID:165]", "Student: Overnight [ID:185]", "Student: Meeting [ID:166]", "Student: Panel [ID:167]", "Student: Party [ID:168]", "Student: Reception [ID:170]", "Student: Performance [ID:169]", "Student: Recital [ID:171]", "Student: Rehearsal/Practice [ID:172]", "Student: Religious/Spiritual [ID:183]", "Student: Seminar [ID:174]", "Student: Study Break [ID:176]", "Student: Symposium [ID:177]", "Student: Tabling [ID:178]", "Student: Trip [ID:190]", "Student: Wellness [ID:187]", "Student: Workshop [ID:179]") and state in ("Confirmed [ID:2]") ::expected between 50 and 999999 and type in ("Student: Announcement [ID:154]", "Student: Ceremony [ID:155]", "Student: Club Sport [ID:157]", "Student: Club Sport Contest [ID:192]", "Student: Community Service [ID:158]", "Student: Club Sport Practice [ID:193]", "Student: Concert [ID:159]", "Student: Conference [ID:160]", "Student: Symposium [ID:177]", "Student: Study Break [ID:176]", "Student: Religious/Spiritual [ID:183]", "Student: Seminar [ID:174]", "Student: Rehearsal/Practice [ID:172]", "Student: Recital [ID:171]", "Student: Reception [ID:170]", "Student: Performance [ID:169]", "Student: Party [ID:168]", "Student: Panel [ID:167]", "Student: Overnight [ID:185]", "Student: Meeting [ID:166]", "Student: Lunch/Brunch [ID:165]", "Student: Lecture [ID:164]", "Student: Film Showing [ID:163]", "Student: Exhibit [ID:162]", "Student: Dinner [ID:161]") and state in ("Confirmed [ID:2]") |
The top query in Table 3.3.2 is the search criteria we used in SeriesQL to retrieve the results of all confirmed student event reservations in the following time frames: Fall 2018, Spring 2019, Fall 2019, Spring 2020, Fall 2022, Spring 2023, Fall 2023, and Spring 2024. The second query (bottom query in Table 3.3.2) was used to get the subset of all large event reservations over time, filtering by events with an expected headcount over 50. Reports ran from the top search query consistently use September 1st to December 30th as the Fall semester date range and January 1st to May 31st as the Spring semester date range. Results from the second query were split into two date range searches: 9/1/2018-12/31/2024 and 9/1/2008-5/31/2018.
3.4 Archives
Finally, we actually took a visit to our College’s archives and were able to look at the historic significance of “spam,” the name for the popular paper fliers advertising events on campus. We looked backwards through the catalogues to find pieces of “spam” for events held from the 1970s to early 2000s. This afforded us a better understanding as to why this, now antiquated mode, was still favored by many students, it is a fun tradition of our school.

Data Analysis
4.1 Survey
Our survey gave us extensive quantitative data to analyze where we found that students have really enjoyed the ease of digital communication and leaning into emails as a way of learning about events. However, we did also learn that organizers mostly use Physical Spam as a means of publishing. Now, granted both of these questions are multi-select given that people see, and use multiple types of publishing so it is worth noting that many organizers are probably using a combination of these means.
Additionally we recorded a lot of written responses in the survey where people explained their many frustrations with events on campus. We heard that people were overwhelmed, felt there were too many events, or too many similar events. There was overstimulation at the spam boards, people were bombarded with emails and Google Calendar invites, and people who have given up, only attending events if a friend directly brought them. Conversely, we also heard from organizers who are battling low attendance and interest. We heard of many events generating food waste, from under attendance, and disheartened organizers. Most of these comments were similar to why we chose to pursue this issue in the first place and we used these responses to guide the questions we asked in our Town Hall focus group.
Interestingly, with our own survey, we found that the best means of publishing was online, it spread easily and took little effort and led to a greater number of responses than physical spam. Yet we hesitate to propose an online-only solution as reliance on technology can further fracture communities as we’ve found people who are not “on” Google email groups or following Instagram accounts or actively checking Sidechate might not necessarily hear about an event in time.
The survey was our first mode of data collection and we used this to inform the rest of our process as we sought to understand why there were so many frustrations building up over events that are meant to be fun, social, and community-strengthening.
4.2 Town Hall
Question 1: Do you think there are too many events happening on campus?
Our attendees-only group concluded that there were too many events happening on campus, more specifically, too many events that were too similar. They cited study breaks specifically as events hosted in oversaturation as many orgs host them at the same time with little difference in content. This leads to a lot of SPAM in people’s inboxes and plastered around campus pubbing the same event, eventually yielding little attendance at every event. The Eboard/hosts event concluded that there were not too many events happening on campus. They agreed that the large number of events makes it difficult to attend them all but they believed that people will ultimately go to the ones that align with their schedule or that they are especially excited about. A quote from their group was as follows, “There are not necessarily too many events. People are busy, so you just have to find a time where you can go to an event, and sometimes these events are really similar.”
There is a clear disparity in what the intended audience for events feels versus what the organizers of the events feel. The Eboard/hosts felt strongly that a diverse selection of events hosted by many different people caters to a diverse community with varied interests. The attendees, however, stated that many events don’t draw their attention and they are rarely motivated to go to events. A proposed solution for those who host events to boost attendance and to better meet the needs of the community would be to collaborate with other organizations when hosting events. Not only does this bring distinct communities in contact with each other but also cuts down on the number of similar events happening at once so that more people can attend.
Question 2+3: When would the ideal time for events be for you? Does that change based on the type of event?
Our Eboard/hosts and attendees only groups both prefer events after 4:30pm on weekdays. They usually hold eboard or general members meetings for clubs on these times since people are usually free after class and have a free block before dinner. For events, this group and the attendees only group reported that food at an event dramatically increases the likelihood of their attendance. If dinner is served at an event around mealtime, students reported feeling less stressed about fitting that event into their schedule because they would have had to eat anyway and are now able to attend an event and eat at the same time without drastically impacting their academic/personal calendars. The participants also stated that they would only go to weekend events if they were large events like culture shows because their weekends are otherwise usually busy.
Proposed solutions for those who host events would be ensuring that their events are after 4:30 and organizers could send out forms asking when best works for general members before they set a date. A potential conflict that could arise if all events are hosted after 4:30 on weekdays would be too many events happening at once. Organizers could remedy this by collaborating with other organizations.
Question 4: Preferred medium to hear about events?
Both the attendees and Eboard/hosts groups agreed as a whole that digital advertising is more effective in publicizing events as it is more permanent than a physical flyer. While one might only see a flyer when they are in the dining hall or in their dorm, an email is present every time they open their inbox. Our attendees also reported that they appreciate when emails include a link that automatically populates an organization’s event onto their google calendar so they don’t have to manually add anything. This makes it easier to remember when events are and people are often reminded and more inclined to go to an event when it is already in their calendar. Digital spam is also preferred to physical spam because people rarely intentionally internalize spam boards on campus and often forget about events published there. Both groups, however, did highlight the merits of physical spam as it does serve a purpose and can be effective if placed in the right areas. The Eboard/hosts group reported that they use Sidechat often as a last minute boost before an event is beginning to remind people of the event.
A proposed solution to this would be ensuring that when pubbing an event, organizers are utilizing all mediums of advertising. Only using physical spam and instagram posts is not as effective as using them as well as emails to reach a wider audience and remind people that an event is happening.
Question 5: Where do you think SPAM should be put up?
Both the attendees and Eboard/hosts group concluded that physical spam is most effective in elevators since people are in a closed setting and are forced to look at it. They also highlighted lulu and dorm community boards as effective places because there is a lot of foot traffic in those areas. All attendees agreed that sending out digital versions of physical spams through email is really effective as people are still able to appreciate the flyers but also save the event digitally.
Question 6: What would your ideal centralized event publication look like?
The data for this question was recorded through written responses as instead of discussing with their peers before responding, all attendees recorded their individual responses. Many responses advocated more organization specific google calendars as they are a constant reminder of what is coming up, allowing people to plan ahead and accommodate if they are especially interested in an event. Email chains with a link to add event to one’s google calendar was also advocated for. The main recommendation from our attendees was a community calendar with all of the events happening on campus so that people can go there to see all events, not just the ones they are on email lists for.
A community wide calendar is in the works by LTS and will hopefully solve this issue and better meet student needs. In the meantime, organization specific google calendars and invites are strongly encouraged to boost attendance for campus events.
4.3 25Live
To investigate our first area of inquiry, we created heatmaps to illustrate the density of events hosted per month. Overall, our data demonstrated that there has been a significant increase in events happening each calendar year, especially after the Covid-19 pandemic disrupted campus life. We observe several trends involving the number of events held regarding the time period on a macroscopic scale. April, across all academic years, has always held the highest number of events with exception to the pandemic year). In our heatmap, we use darker blocks to represent months of the academic year which held a greater magnitude of events. From year to year, we can see that each academic year is generally filled with a darker shade than the previous year. In our meeting with this stakeholder group, we learned that the most recent academic year (2023–2024) has seen the highest number of event reservations on this campus, reflected by the darkest square on the heatmap in April 2024, which held 313 general events, and 168 student-specific (excluding meetings, practices, rehearsals), and 64 largely attended events in that month alone, accounting for 1800 events overall (29.14% of all-time data).
In meeting with our stakeholders, we learned that planning for large events has become increasingly difficult with the continuous population of new student organizations and competing event timelines. Our stakeholders mentioned several instances of needing to account for “noise-bleed,” the possibility that a largely attended event with loud noise might interfere with the environment of another largely attended event. Consequently, when helping student organization leaders plan and manage their event, they would need to ensure that the requested time and date wouldn’t conflict with another large event opportunity and that the event experience would be seamless for the organizations that host them. When competing timelines were unable to be resolved, our stakeholders mentioned that they would host the events preferably at two ends of the campus (West side/ East side) to eliminate noise bleed and adjust timelines to extend or shorten to accommodate for simultaneous activities. Additionally, at events that expected hundreds of students in attendance that were in conflict with another high attendance event, our admin stakeholders recognized that student organizations were dissatisfied with the turnout of their event, hoping to have received more attendance if they had occurred on a separate occasion to the other. To demonstrate this problem further, we created several visualizations to represent the measure of events happening on various time scales.
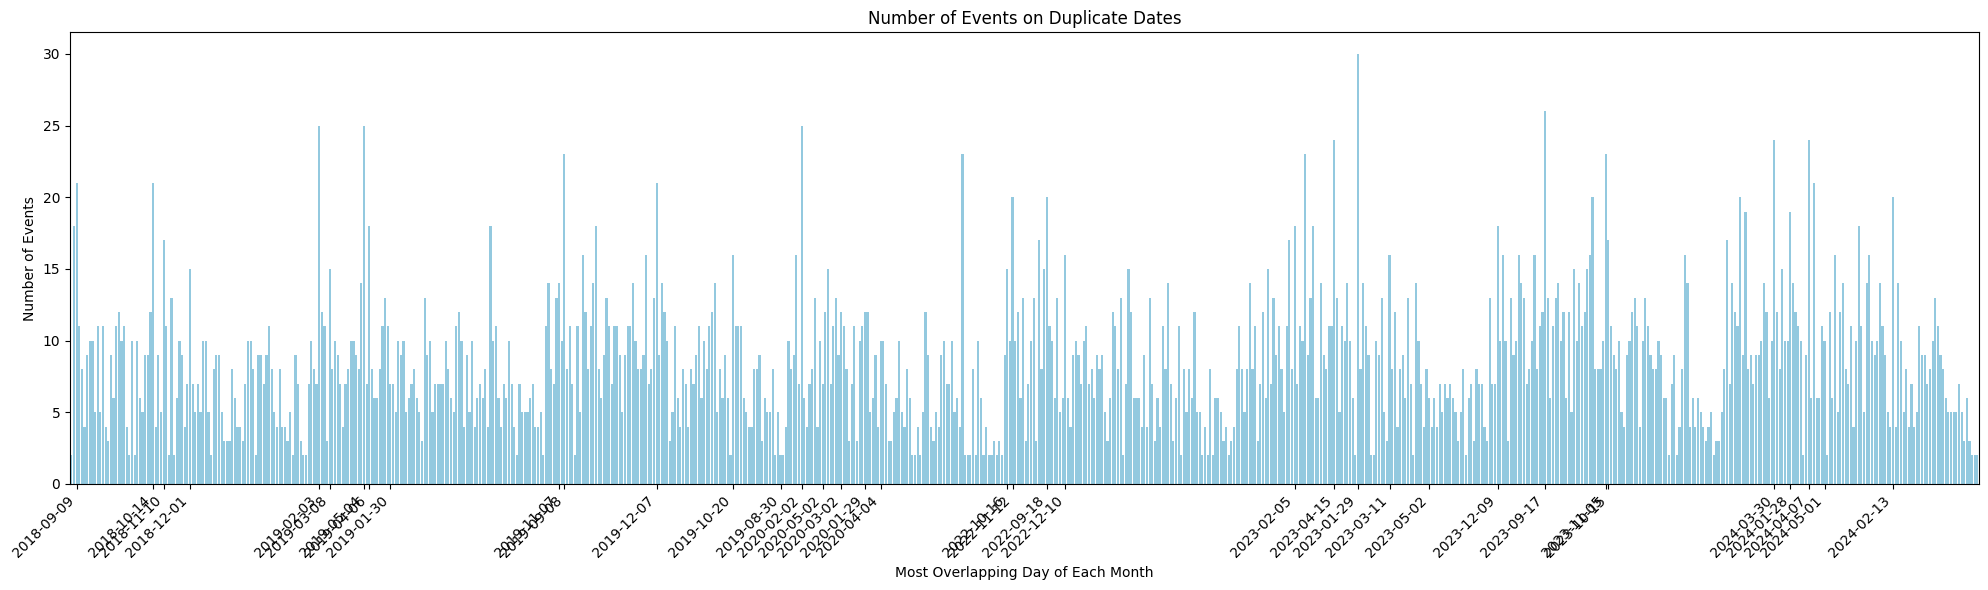
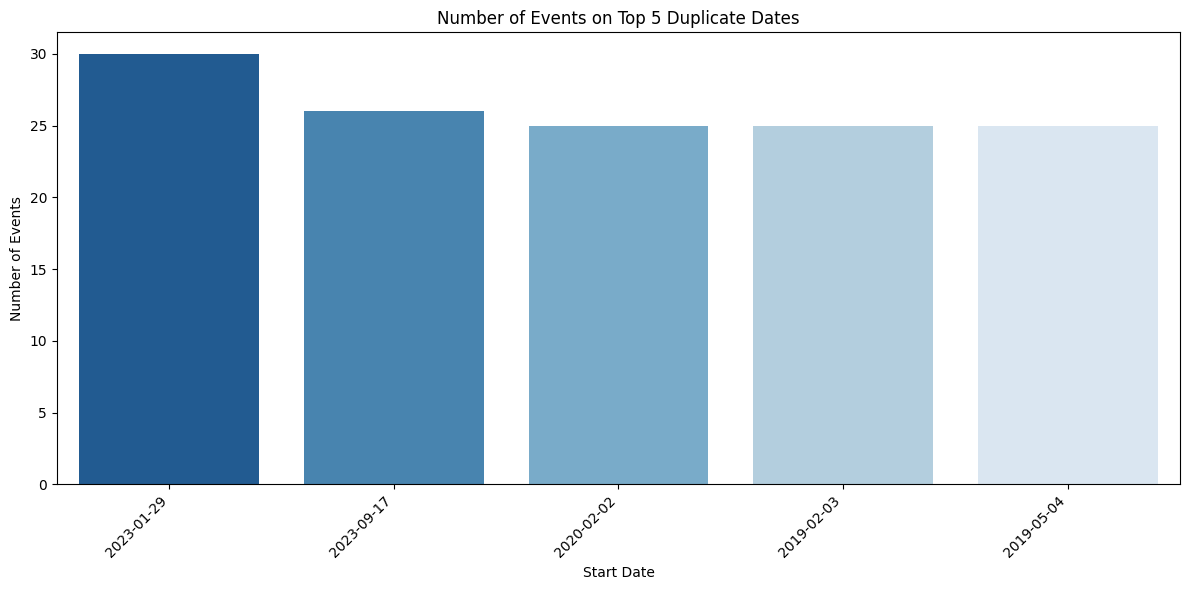
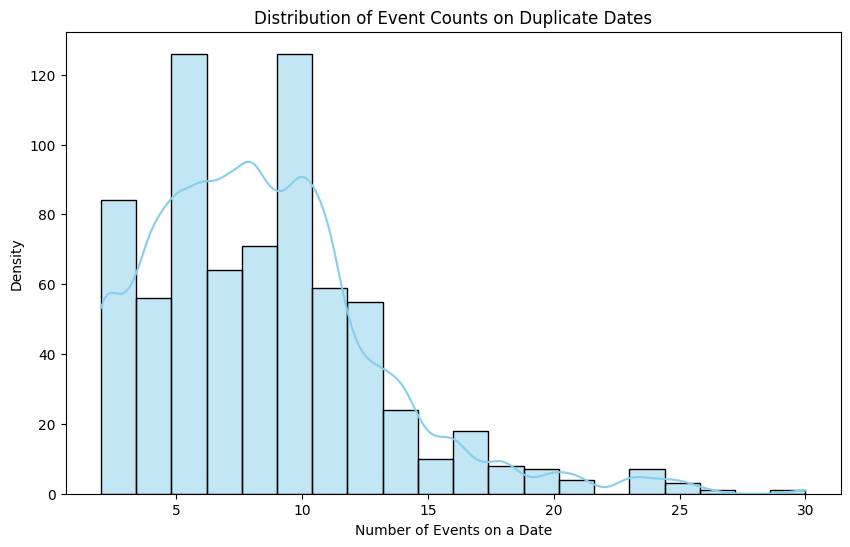
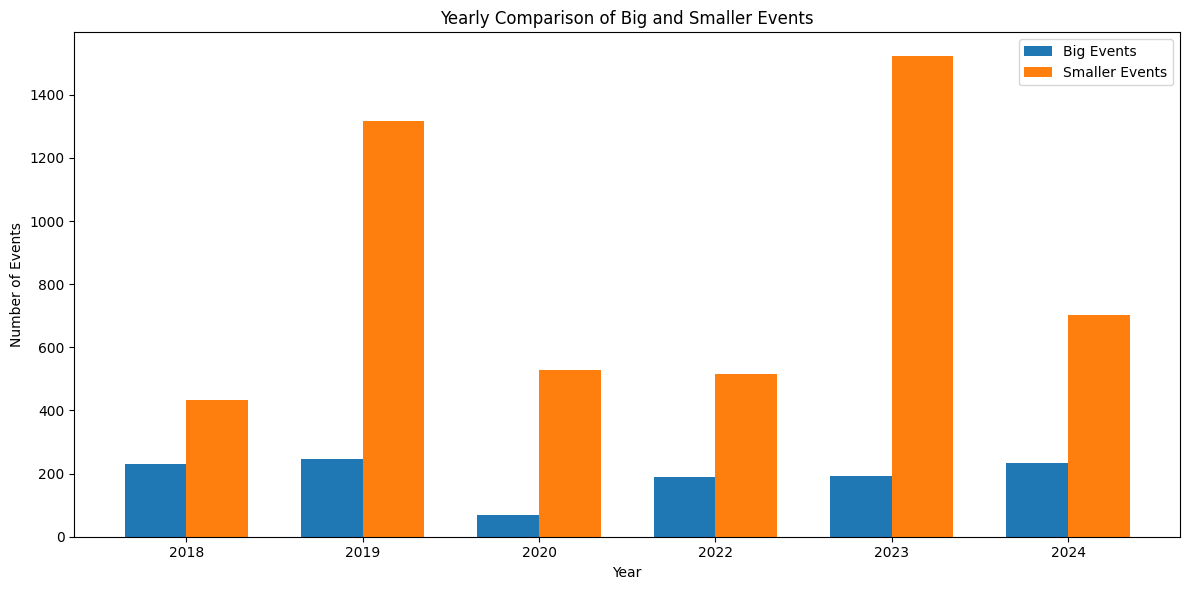
In Figure 4.2.4, the visualization plots all days which had at least one event on a particular date. The significant spikes in the graph indicate the specific days which had a large number of events happening on that day. To abstract our findings, we created a secondary visualization for just the top 5 days which had the highest number of events held on them (see Figure 4.2.5). In the leftmost bar, indicating the number of events held on January 29th, 2023, we observe 30 events on that day alone. A summary of our data and a visualization (see Table 4.2.6 and Figure 4.2.7) of the distribution of events shared on the same date demonstrates a clear pattern: while there are occasional spikes with a significant number of events on a single day, the overall distribution reveals that event counts are consistently high, further supporting the presence of competing timelines. Additionally, when charting the relationship between large events (events expecting significant attendance) and smaller events (see Figure 4.2.8), we see a steady increase in the number of smaller events while the count of large events on campus consistently remains at around 200. The relative stability in the overall number of large events amidst the proliferation in hosting smaller events could indicate potential strain or competition for attendance and resources. These findings underscore that while the campus continues to host a growing volume of events, the concentration of several activities on the same dates could be a source of fragmented engagement, hindering opportunities for larger events to reach their full potential. We believe that this oversaturation of events on campus has potentially become detrimental to the quality of events and the attendance of people at each event.
| Mean | Median | Standard Deviation | Minimum | Maximum | Mode | Antimode* | |
|---|---|---|---|---|---|---|---|
| Number of Events | 8.446133 | 8.000000 | 4.494487 | 2.000000 | 30.000000 | 8.000000 | 30.000000 |
| Number of Dates with Specified Event Count | 71.000000 | 48.000000 | 1.000000 | 71.000000 | 1.000000 |
Table 4.2.6: Summary of Dates with >1 Events Reserved Data
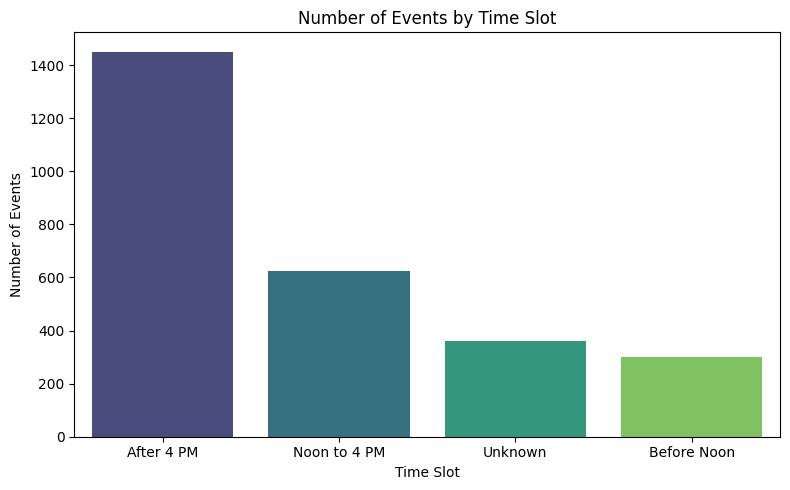
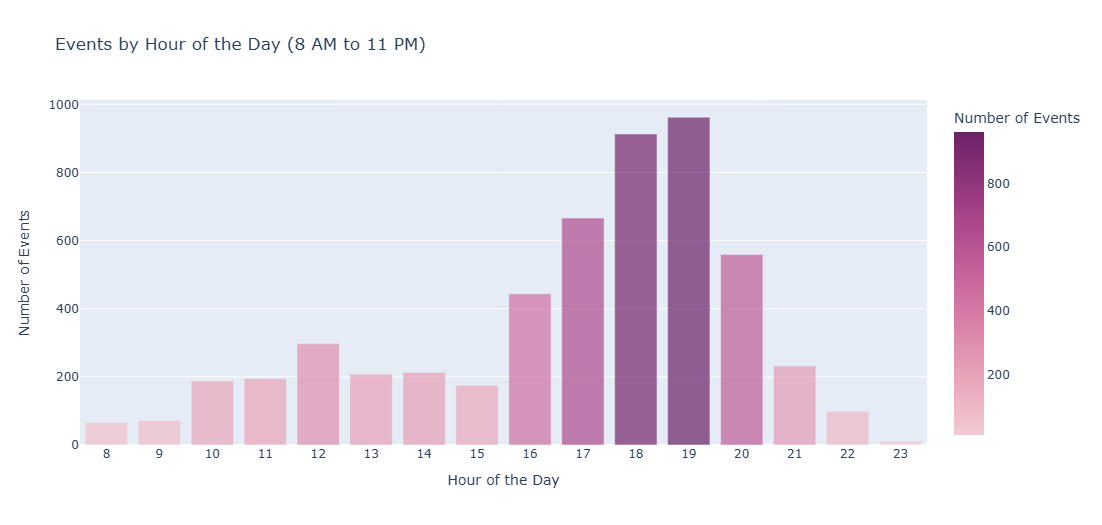
From the following figures, Figure 4.2.9 and Figure 4.2.10, we observe that a significant majority of events occur after 4pm, with the most popular starting time for events being 7:00pm, closely followed by 6:00pm. This data, supported by our primary sources of data collection, strongly aligns with student preference criteria as reflected in event reservations. Through our Town Hall discussions and survey responses, it was clear that both event attendees and organizers favor hosting and attending events between 4:00pm and 7:30pm, with a notable preference for events that include food around meal times, such as 5:00pm or 6:00pm. The data collected via 25Live clearly corroborates these preferences, showing a majority of events happening within this preferred time frame, thus validating our understanding of student behavior and preferences.
In essence, our analysis indicates that the increasing number of events across campus can indeed reduce the opportunity for events to achieve high attendance counts. This phenomenon is linked to the strain on resources and audience engagement caused by the increase of smaller events, which compete for the same time slots, resources, and attendees. When multiple events are scheduled concurrently, it fragments the potential audience, making it challenging for any single event to draw a large crowd. Additionally, the consistent scheduling preferences observed in our data strongly align with student behaviors. Students and event organizers show a clear preference for events scheduled between late afternoon and early evening, particularly around meal times. Our data in the increasing number of events scheduled during these peak times indicates a strong student preference for this event timing. Consequently, aligning event planning with these preferences can enhance overall campus engagement and ensure that both large and small events are successful without detracting from each other. These findings underscore the importance of strategic event management to balance the quantity and quality of campus events.
4.4 Archives
In the spam we were able to find from the Archives collection, there are several key observations we can make about the historical trends in spam over the past couple of decades. A summary of our key observations on the characterization of spam can be found below (see Table 4.4.1). Overall, we can generalize that not only has the dissemination of spam become more digitized over the years, but the creation of spam has become increasingly intertwined with digital technology as well. In the earliest dated artifacts of spam we were able to find from 1978, we can observe that the purpose of spam is purely informational. The overall designs of the spam are clear, concise, and minimal, and integrate typewritten text with handwritten text. In contrast, the most recent piece of spam found from our archival search circa 2007, cites Google as the source for its images, and the design of the spam is clearly formatted through a digital software with digital typeface packages such as Century Gothic and Times New Roman. Now, the creation of our spam has further evolved. The majority of spam across campus can appear almost identical as they simply modify event-specific information on Canva templates, a digital software, specially made to lower the learning curve for everyday graphic designs. To understand why these design progressions may have occurred and how they have shaped the spam we have today, we further examine the differences throughout each decade of Wellesley’s spam and publicizing strategies.
| Time Frame | Observations |
|---|---|
| 1978 |
• Headings in All Caps • Descriptions in Title Case or Sentence Case for Longer Sections of Text • About Half of Spam from This Year Uses a Combination of Typewriting Text with Handwritten Text • Almost No Graphic Components Besides Club Logo • Consistent Font Style (Family) Used Throughout Flier • Spam Printed on White and Yellow Paper Exclusively |
| 1979 |
• Event Title Is Roughly 2x the Size of Other Text on Fliers • Key Information (Date, Time, Location) Emphasized in Bold, Uppercase, Larger Font, or Underlined • Graphics (Drawn Pictures) Taking Up 50% of the Flier or More Used in Roughly Half of the Spam • Spam Printed on Pink, Orange, and White Paper |
| 1981-1982 | • 3-4 Variations of Font Styles Used Across All Fliers |
| 1983-1989 |
• About a Quarter of Fliers Integrate Photographs into the Flier
Design • The Majority of Fliers Now Have Graphics Taking Up 50% of the Flier: If Not Hand-Drawn, Then Photographs • All Fliers Use at Least 2 Font Style Variations: One Style for Headings and One Style Used for Body/Descriptive Text • Huge Variation in Paper Colors Used: Orange, Yellow, White, Pink, Blue |
| 1993-1996 |
• All Spam Now Includes Contact Information for Questions Using
Extension Numbers • 75% of Spam Uses Typed Font Rather Than Handwritten Text • All Spam Uses One Consistent Font Style • Spam Still Uses Various Paper Colors |
| 2001-2007 |
• All Spam Features Photographs • Black and White Printed on Colored Paper • Use of Colored Printing in Spam: Designs Feature Various Colors for Different Components • All Spam Uses Digital Font Rather Than Handwriting • Spam Uses 1-2 Font Styles |
Discussion
We found, in publishing and advertising our own survey that online was the best way to go, it was faster and more effective. For reference, for our physical spam, we printed out and put up 30 pieces. They took about ~30 minutes to design and then each group project member had to walk to different residence halls, academic buildings, and dining halls to post the flyers. All this work yielded 7 responses, 7, that’s it. It was time intensive and with very little efficacy.
However, that is not to say that it wasn’t worth it to make the physical spam. In the written responses of the survey, many people responded that they really enjoy physical spam. People cited visual appeal, historic connection, and an appreciation for the time and effort put into it as reasons they enjoyed the merits of this tradition. People have said they enjoy periodically checking the spam boards and seeing all the events that are happening at the College. Additionally, we, as the researchers, quite enjoyed making the spam, it was fun and creative and a good break from the tedium of homework.
In our visit to the archives, we got to see a lot of the historic spam from Wellesley Clubs such as the Felding Society, Philosophy Club, and the Film Society, dating back as far as the 1970s. We also got to look at hand-made booklets from the College’s Float Day, Tree Day, and Crew events in the 1960s. Seeing the meticulous care put into the drawings, handwriting, and creative messaging of these posters helped us understand why spam remains a cherished form of campus communication: it is a relic and tradition of the past. We enjoyed all the care that was put into the drawings, handwriting, and fun quips used to advertise the events. It was a great trip to the past and led us to have a greater appreciation for the physical posters that decorate our campus, even if we originally found it archaic.
From the Town Hall, we heard great insights about student perceptions on event saturation, timing, and communication preferences. Ultimately, our meeting confirmed that physical spam, though time attentive and limited in reach, remains well liked by students, particularly when placed in high-traffic locations. The visual appeals make it stand out, offering a break from the digital clutter. Meanwhile, digital communication tools like GCal and email emerged as essential for ensuring efficiency and broader reach in event promotion. Moving forward, our findings suggest that event organizers can better engage students by blending their preferences. This includes prioritizing strategic spam placement, utilizing email lists and department newsletters, offering clear and attractive messaging, and incorporating interesting food options for events. This can effectively combine both physical and digital methods in a way that ensures a broader reach while still respecting students’ time and preferences.
Conclusion
Our data was used to generate the main conclusions in our main deliverable, the pamphlet guide to publishing spam + events on campus. We wove together data from all our sources to create actionable steps towards improving these events, and their turn out, that help grow our community on campus. Our research group hypothesized that the overwhelming increase of event publicity (“spam”) across all relevant communication platforms may be an underlying cause for dwindling attendance. In an effort to understand the nuances of how to ensure attendance at events, we collected data from multiple sources including 25Live data, surveys from the general public, a record on the evolution of pubbing from Wellesley’s archives, and qualitative data from an in-person town hall. Through our analysis, we identified (stakeholder-specific) strategies that would drastically increase event attendance and likely boost community morale on campus.
Data from all sources reinforced each other and confirmed a significant increase in events on campus, yielding lower attendance rates per event as students are overwhelmed by choice. A main solution to this problem would be encouraging collaboration between organizations in events. The need for distinctive cultural and identity-affirming events are clear, however, collaboration outside of these larger events is crucial in creating a more interwoven community. As more organizations are created each year—many variations on organizations that already exist—the Wellesley community becomes more fractured and individualistic. This problem is worsened when the calendar begins to fill up and orgs must compete with each other for attendance when they could instead collaborate and host events that comingle groups that would ordinarily not be in contact with each other. With multiple hosts, these organizations will find it easier to publicize their events and divide labor efficiently.
In her introduction of Envisioning the Good Life in the 21st Century and Beyond, Shannon Vallor claims, “A global information society enabled by a massive electronic communications network of unprecedented bandwidth and computing power has indeed emerged; but far from enabling a ‘new world order’ of a utopian or dystopian sort, the information age heralds an increasingly disordered geopolitics and widening fractures in the public commons.” (Vallor, 5). Technology—through email chains you must be enrolled in and Instagram accounts you must follow—boxes ourselves into groups at Wellesley. Once we are neatly tucked away, it becomes easy to not venture out. Each digital pubbing channel is highly specific to the group in mind, making it hard for non group members to hear about events they might be interested in. The aims of this class include how one may live well in harmony with technology, and not to let technology shape the way we live. If we continue to hold community events in isolated forums, the possibility of a fractured Wellesley community becomes more real with cracks deepening by isolation perpetrated by organization-specific technologies. To bridge these potential gaps and bring together our community as well as living a technologically good life that is in tandem with technology, we must work together to host events and bring new people and perspectives into the conversation.
References
• Using the SeriesQL Search Syntax
• Float Night: Programs, 1887-1894
• Asian Association, 1978-1995